
Sydney Property: Housing Market Outlook: Sydney's housing mark
Sydney's housing market outlook for 2027 shows cautious optimism. After a period of adjustment to higher interest rates, the property market is showing.
6 min read

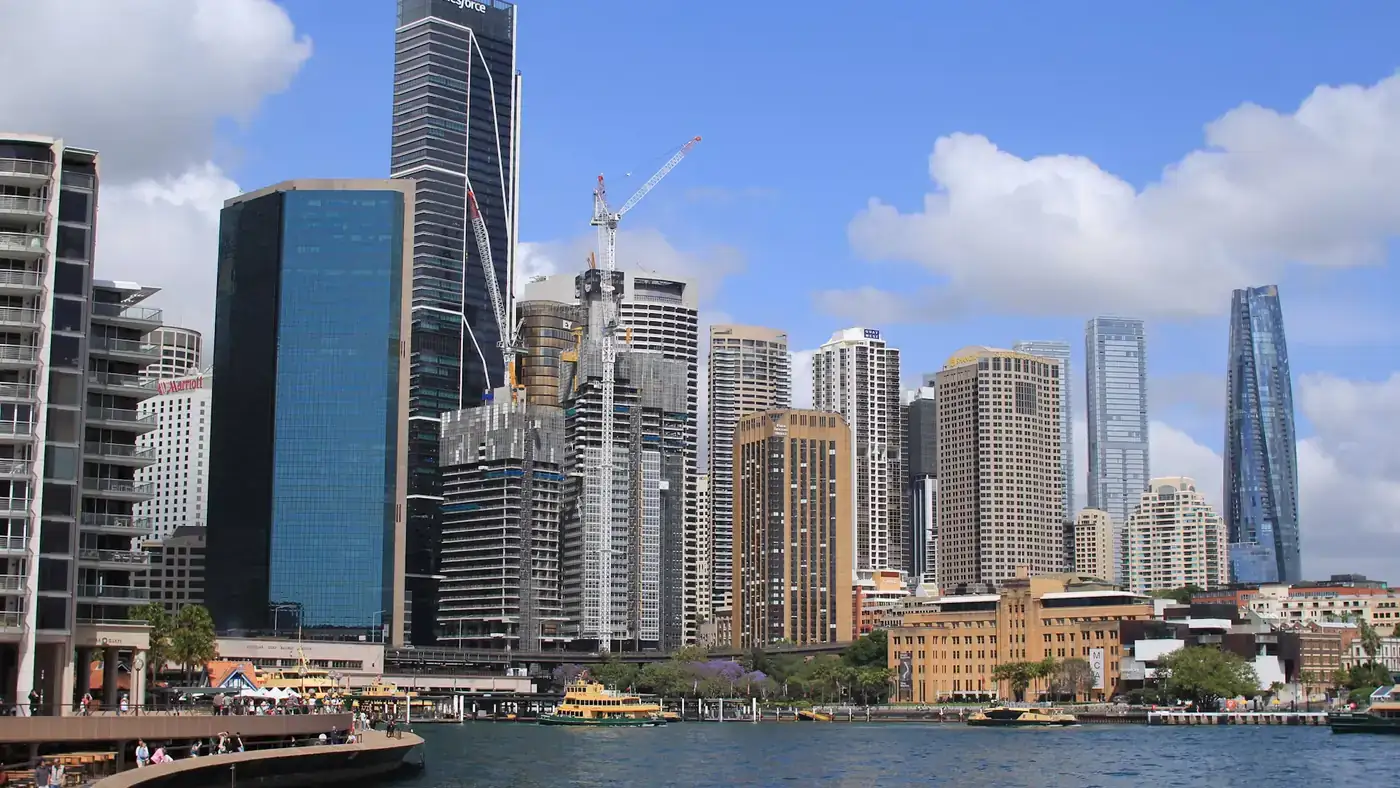
Sydney CBD office vacancy fell to 13.3 percent in the six months to June 2026, down from 13.8 percent, as flight-to-quality tightened premium stock.
The Property Desk is a contributing writer covering property and public affairs for The Sydney Times.
Sydney CBD office vacancy fell to 13.3 percent in the six months to June 2026, down from 13.8 percent in January, as the structural flight-to-quality trend tightened premium and A-grade vacancy to 8.9 percent while secondary stock remained under pressure at 14.9 percent. The improvement is the clearest signal yet that Sydney's office market has moved from the correction phase of the past three years into a selective recovery defined by asset quality rather than broad-based demand.
The Property Council of Australia office market report for the first half of 2026, released in August, documented the split. Premium vacancy declined 1.2 percentage points to 10.2 percent over the six-month period, while secondary vacancy barely moved. Across the broader national market, vacancy climbed to 16.1 percent, the highest since the early 1990s recession, but Sydney, Melbourne, Perth, and Brisbane all recorded slight falls of less than 2 percent, marking the first coordinated improvement across the major capitals since the pandemic.
The divergence between asset grades is the defining feature of the current cycle. Knight Frank data shows that prime vacancy in the Sydney CBD tightened from 13 percent to 8.9 percent over the past two years, while secondary vacancy remained elevated at 14.9 percent. Over the past five years, premium grade stock achieved positive net absorption of 314,100 square metres, compared with cumulative negative absorption of 230,866 square metres in the secondary market. The CBD Core precinct was the only area to record positive absorption over that five-year period.
JLL reported that the Sydney CBD recorded 39,300 square metres of year-to-date net absorption through the second quarter of 2026, with no new supply delivered in the first half of the year. The absence of completions has allowed existing premium stock to absorb demand more effectively, with the supply pipeline of 175,600 square metres under construction across four projects representing a 3.3 percent increase to total stock. CBRE received 141 leasing enquiries totalling 125,230 square metres in the first quarter, a 22 percent improvement on the same quarter in 2025.
Rental growth has followed the same pattern. Premium net effective rents rose 3.7 percent year-on-year to $912 per square metre per annum in the first quarter, while A-grade recorded the strongest annual growth at 5.2 percent to $747 per square metre per annum. Secondary rents declined 2.8 percent year-on-year to an average of $503 per square metre per annum, reflecting weaker occupier demand and higher incentives.
The national office supply picture remains constrained. Property Council data shows that just 176,303 square metres of office space was completed nationally in the first half of 2026, the lowest level since July 2017. In the Sydney CBD, the next major delivery is the 58,000 square metre 8-10 Lee Street development, scheduled for completion in the fourth quarter of 2026, with approximately 20,000 square metres to be subleased by Atlassian. Further ahead, the 2027 pipeline includes 2 Chifley Square at 60,000 square metres and 37-55 Pitt Street delivering 62,000 square metres with 22,000 square metres pre-committed.
The supply constraints mean that overall vacancy is likely to remain elevated until absorption strengthens, but the strong pre-commitment levels in premium developments should support rental stability in core assets. Cushman and Wakefield noted that prime net face rents increased by 5.5 percent over the year to the fourth quarter of 2025, reaching $1,397 per square metre gross face, while incentives edged down slightly from 36.4 percent to 35.6 percent in prime locations.
Investment sentiment has also improved. Sydney CBD transaction volumes totalled $3.3 billion over the year to mid-2026, supported by domestic and offshore capital. Major transactions included the sale of Grosvenor Place to GPT and the Commonwealth Superannuation Corporation for approximately $1.3 billion for a 75 percent stake, and 135 King Street to Daibiru Corporation for $631.5 million. Domestic capital accounted for 43 percent of total investment volume in 2026, marking a shift from 2022 when offshore capital dominated.
The flight-to-quality trend has practical implications for both tenants and investors. Businesses are consolidating into better-located, higher-amenity assets, and the willingness to pay rent premiums for modern space with strong transport connectivity is evident in the rental differential between prime and secondary grades, which has widened to close to a decade-high of 29 percent. For tenants in secondary stock, the market remains a landlord's market only in the premium segment; secondary tenants continue to have leverage to negotiate incentives and flexible lease terms.
For investors, the market has bottomed out in prime locations. Knight Frank noted that prime and secondary yields closed 2025 at 5.70 percent and 6.25 percent respectively, reflecting compression of 33 basis points and 25 basis points from peak to trough. Yield spreads between the Core precinct and secondary locations have widened, with the Core commanding a 139 basis point premium over the Southern precinct. Capital values are transitioning into growth as rental expectations improve and supply constraints tighten.
The outlook is contingent on interest rates and economic growth. The RBA's cash rate, held at 4.35 percent in September 2026, continues to moderate investor risk appetite, but the underlying fundamentals of the Sydney CBD office market remain strong. Limited new supply, positive rental growth expectations in premium assets, and improving tenant demand are likely to support targeted acquisition opportunities, with a clear preference for prime, well-located buildings that offer strong transport connectivity and integrated amenity.
The latest JLL Sydney Office Market Dynamics report is available at JLL Sydney Office. Knight Frank's Sydney CBD Office Market H1 2026 analysis is published at Knight Frank Research. The Property Council of Australia national office vacancy data is released at Property Council of Australia.
Explore more Sydney property analysis at the Property & Suburbs hub
Read about Sydney city planning and infrastructure at The City hub
Direct inquiries, corrections, or documentation concerning this dispatch to our editorial newsroom desk.
Sydney's housing market outlook for 2027 shows cautious optimism. After a period of adjustment to higher interest rates, the property market is showing.

Sydney's commercial property market is showing signs of recovery. After a prolonged period of uncertainty, the city's office and retail sectors.

Sydney's rental market is showing signs of stabilisation as vacancy rates shift. The property market is adjusting to new supply levels and changing tenant.
NSW rental vacancy rate dropped to 1.2% in September 2026, putting pressure on rents as supply stays tight across Greater Sydney and regional centres.